
Essay Content Strategy
Measuring Content Marketing ROI for Early-Stage B2B Companies
Track content's true pipeline impact with proper cost accounting and attribution modeling.
A content program rarely dies because the writing is weak or the strategy is wrong. It dies in a budget review, when someone pulls up a pageview chart that has gone flat for two quarters running and nobody in the room can draw a line from that chart to a closed deal. The room goes quiet, the traffic numbers look soft next to a paid channel's cost-per-lead report, and the program gets cut. What failed in that room is the measurement chain connecting the content to the pipeline it was already influencing.
The timing of that failure matters because B2B buying cycles run long, often many months from first contact to signed contract. Gartner's 2024 survey of 632 B2B buyers found that a majority of B2B buyers now prefer a buying experience with no sales rep involved at all: they read blog posts, compare vendors on review sites, and consult AI tools long before a rep knows the account exists. Most of that research activity leaves either no trace in a CRM or a trace that gets misattributed. Standard last-click attribution hands all the credit to whatever touchpoint happened right before conversion, usually a sales call or a paid ad, and erases the months of content consumption that built the buyer's trust in the first place. Leadership sees a dashboard full of sessions and bounce rates that never resolve into revenue, loses confidence in the function, and shifts budget toward channels whose returns are easier to read on a spreadsheet, even when those returns are smaller.
That shift carries a cost that compounds in the wrong direction. Organic content returns tend to grow over time rather than flatten, roughly doubling in value between the 12-month mark and the 36-month mark, which is the opposite of how paid channels behave: a paid channel's output stops the instant the spend stops, while a well-built content asset keeps earning long after the invoice for writing it has been paid. Cutting a program in month six because the dashboard looks flat destroys a compounding asset at exactly the point where its return curve was about to bend upward. The loss never appears in any report, because the counterfactual (the pipeline that asset would have generated in month eighteen) does not exist in a spreadsheet to be mourned. It just never happens, and nobody in the next budget review knows to ask why.
Where the measurement chain breaks for most early-stage teams
The measurement chain breaks in the same three places for nearly every early-stage team: data fragmentation, dark social, and AI-driven zero-click behavior. None of these failures reflect a skill gap in the marketing team. Each one is a structural gap in the instrumentation that most seed-stage and Series A companies simply have not built yet.
Data fragmentation is the main cause of the problem: website analytics, marketing automation, and the CRM typically operate as three separate systems that were never wired together, so a contact who reads three blog posts over two weeks and then books a demo through a sales email shows up in the CRM as a sales-sourced lead with no record of the content that got them there. Fixing this requires tagging every meaningful call-to-action as a trackable event and feeding that event into the CRM record, a step most early-stage teams skip because it demands coordination between whoever owns the website and whoever owns the CRM, two people who rarely sit in the same planning meeting.
Dark social compounds the problem in a way that no amount of internal tagging can fix. A substantial share of B2B content sharing happens off the open web entirely: a link dropped in a Slack channel, an email forwarded between colleagues, a PDF passed around in a private community. None of that activity produces a referrer string that analytics software can read, so it gets bucketed as "direct" traffic, a category that functions as a graveyard for attribution.
AI-driven zero-click behavior is the newest and most disruptive of the three. AI Overviews and zero-click search results have broken the attribution chain that most existing content ROI models were built on. A buyer who learns about a brand from an AI-generated summary never clicks through to the website, so that discovery event is invisible to an organic traffic report. Even the clicks that do originate from AI Overviews get folded indiscriminately into standard organic traffic, with no separate line item to show for it. For any team whose entire content ROI case rested on watching organic traffic climb quarter over quarter, this development invalidates the baseline the whole argument was built on, and nothing has arrived yet to replace it.
The consequence of these three failures together is a systematic bias in the data that makes content look weaker than paid channels regardless of its actual performance, because paid channels produce clean, closed-loop numbers and content does not. Only about a third of marketers can accurately measure content marketing ROI, and most of them are increasing their content budgets anyway. The majority of the industry is spending more money while flying without instruments. Only a third of B2B marketers use any formal attribution model at all, so even teams that believe they are measuring content performance are usually working from assumptions that have never been tested against a model of any kind.
Counting what matters before measuring anything else
Before any ROI number means anything, the cost side of the equation has to be built honestly, and most early-stage teams get this wrong in the same direction: they understate what content actually costs by leaving out internal time and the tools that support it. That omission makes the apparent return look better than it is, and a number that looks too good tends to collapse the moment a finance lead starts asking where the labor cost went.
A complete cost map has four categories. Production costs cover freelancer fees or the salaried time of whoever writes, along with images, equipment, and any other direct input. Distribution and promotion costs cover hosting, email sends, paid amplification, and social promotion. Tooling costs cover the analytics platform, the CRM, and whatever marketing automation software routes the content to its audience. Internal cost covers the hours spent on writing, review, design, SEO, and coordination, multiplied by a fully loaded rate rather than treated as free because it happened inside the building. Teams that skip that fourth category are producing a number that will not survive scrutiny.
Separating one-time costs from recurring ones matters just as much, because the ratio between the two shifts as a piece of content ages. A blog post published a year ago likely carries almost no ongoing cost beyond the hosting it already shares with everything else on the site, yet it may still be generating pipeline every month. Measuring that post's ROI against its original production cost, rather than its current near-zero marginal cost, radically understates how efficient it has become.
The ROI formula itself, [(Return − Investment) / Investment] × 100, is simple enough that it is not where teams get stuck. What counts as a gain is the sticking point. Four approaches fit different stages of attribution maturity, and the right choice depends on what data the company actually has. Revenue-based ROI, which measures actual closed revenue against cost, works well when attribution is reliable and the sales cycle is short enough to close within the reporting window. Margin-based ROI, which substitutes gross margin for raw revenue, holds up better in front of leadership because it avoids inflating the number with low-margin revenue that looks impressive but contributes little to the bottom line. Weighted pipeline ROI, calculated as pipeline value multiplied by close probability, is the right default for most early-stage companies, because revenue has not yet been signed and may not be for months, and this method is honest about that uncertainty. Expected value ROI, which multiplies lead value by attributed lead volume, works as an interim measure when pipeline data itself is still too thin to model with any confidence.
That shift carries a cost that compounds in the wrong direction.
The four metrics that connect content activity to pipeline without enterprise tooling
Four metrics, built with nothing more than UTM parameters, a CRM field, and GA4, connect content activity to pipeline without requiring an enterprise attribution platform: conversion-path traffic, content-influenced pipeline, time-to-close comparison, and AI citation share.
Conversion-path traffic starts the list because it is the fastest to act on and the clearest proof that raw pageviews mislead. The metric that matters is sessions landing on the pages that actually feed conversions, meaning case studies, comparison pages, solution overviews, and pricing pages, not the aggregate traffic count across the whole blog. A case study page converting at 3% on a modest volume of visitors will outperform a high-traffic awareness post converting at a small fraction of that rate, often by a wide margin once pipeline contribution is the unit of comparison. That single comparison tells a content team exactly which pages deserve more investment and which deserve to be cut or redirected toward a different purpose.
Content-influenced pipeline tracks deals where the buyer consumed content before closing, tagged inside the CRM at the moment of first sales contact. Setting this up takes a single new field in the CRM and a habit on the sales team's part: when a rep confirms on a first call that a prospect read a blog post, downloaded a guide, or referenced a case study, that deal gets tagged as content-influenced on the spot. A simple "how did you hear about us" open-text field on every form adds a second layer of signal, catching the dark social shares and AI-driven discoveries that no tracking pixel will ever see. Running a quarterly query against closed-won deals to see how many carry that tag produces a directionally reliable read on content's contribution to revenue, with none of the infrastructure a multi-touch attribution platform would require.
Time-to-close comparison measures the average sales cycle length for leads who engaged with content against those who did not. A shorter cycle for the content-engaged group makes a defensible case for content's value even in a quarter when the revenue attribution itself is still contested, because sales velocity is a number finance already understands and trusts.
AI citation share closes the list, and it deserves more attention than its novelty might suggest, because it is the metric most likely to matter more with each passing year. It tracks whether a brand gets cited by name in AI Overviews and in chat-based answers from tools like ChatGPT or Perplexity, and it functions as a leading indicator of discovery that an organic traffic report cannot capture. AI citation value estimates the impression value created each time that citation happens, capturing a stream of content ROI that the standard formula was never built to see. A team that ignores this metric is measuring against a baseline that is already partially obsolete.
Why simple attribution beats sophisticated models at low conversion volume
Multi-touch attribution has a reputation as the rigorous answer, the tool a serious marketing team eventually graduates into. For a company still at seed or Series A, deploying it early does not produce rigor. It produces a confident-looking chart built on statistical noise, because data-driven attribution needs three things most early-stage companies do not yet have: enough conversion volume to produce a statistically valid model, clean event tagging with consistent UTMs and deduplicated conversions, and a CRM with reliable stage data and a full contact-level activity history.
Most early-stage companies meet none of those three conditions at once, so a sophisticated model applied to their data does not reveal hidden truth. It manufactures false precision out of a dataset too thin to support it, and a false number with decimal points attached is more dangerous in a budget meeting than an honest range, because it invites a confidence nobody has earned.
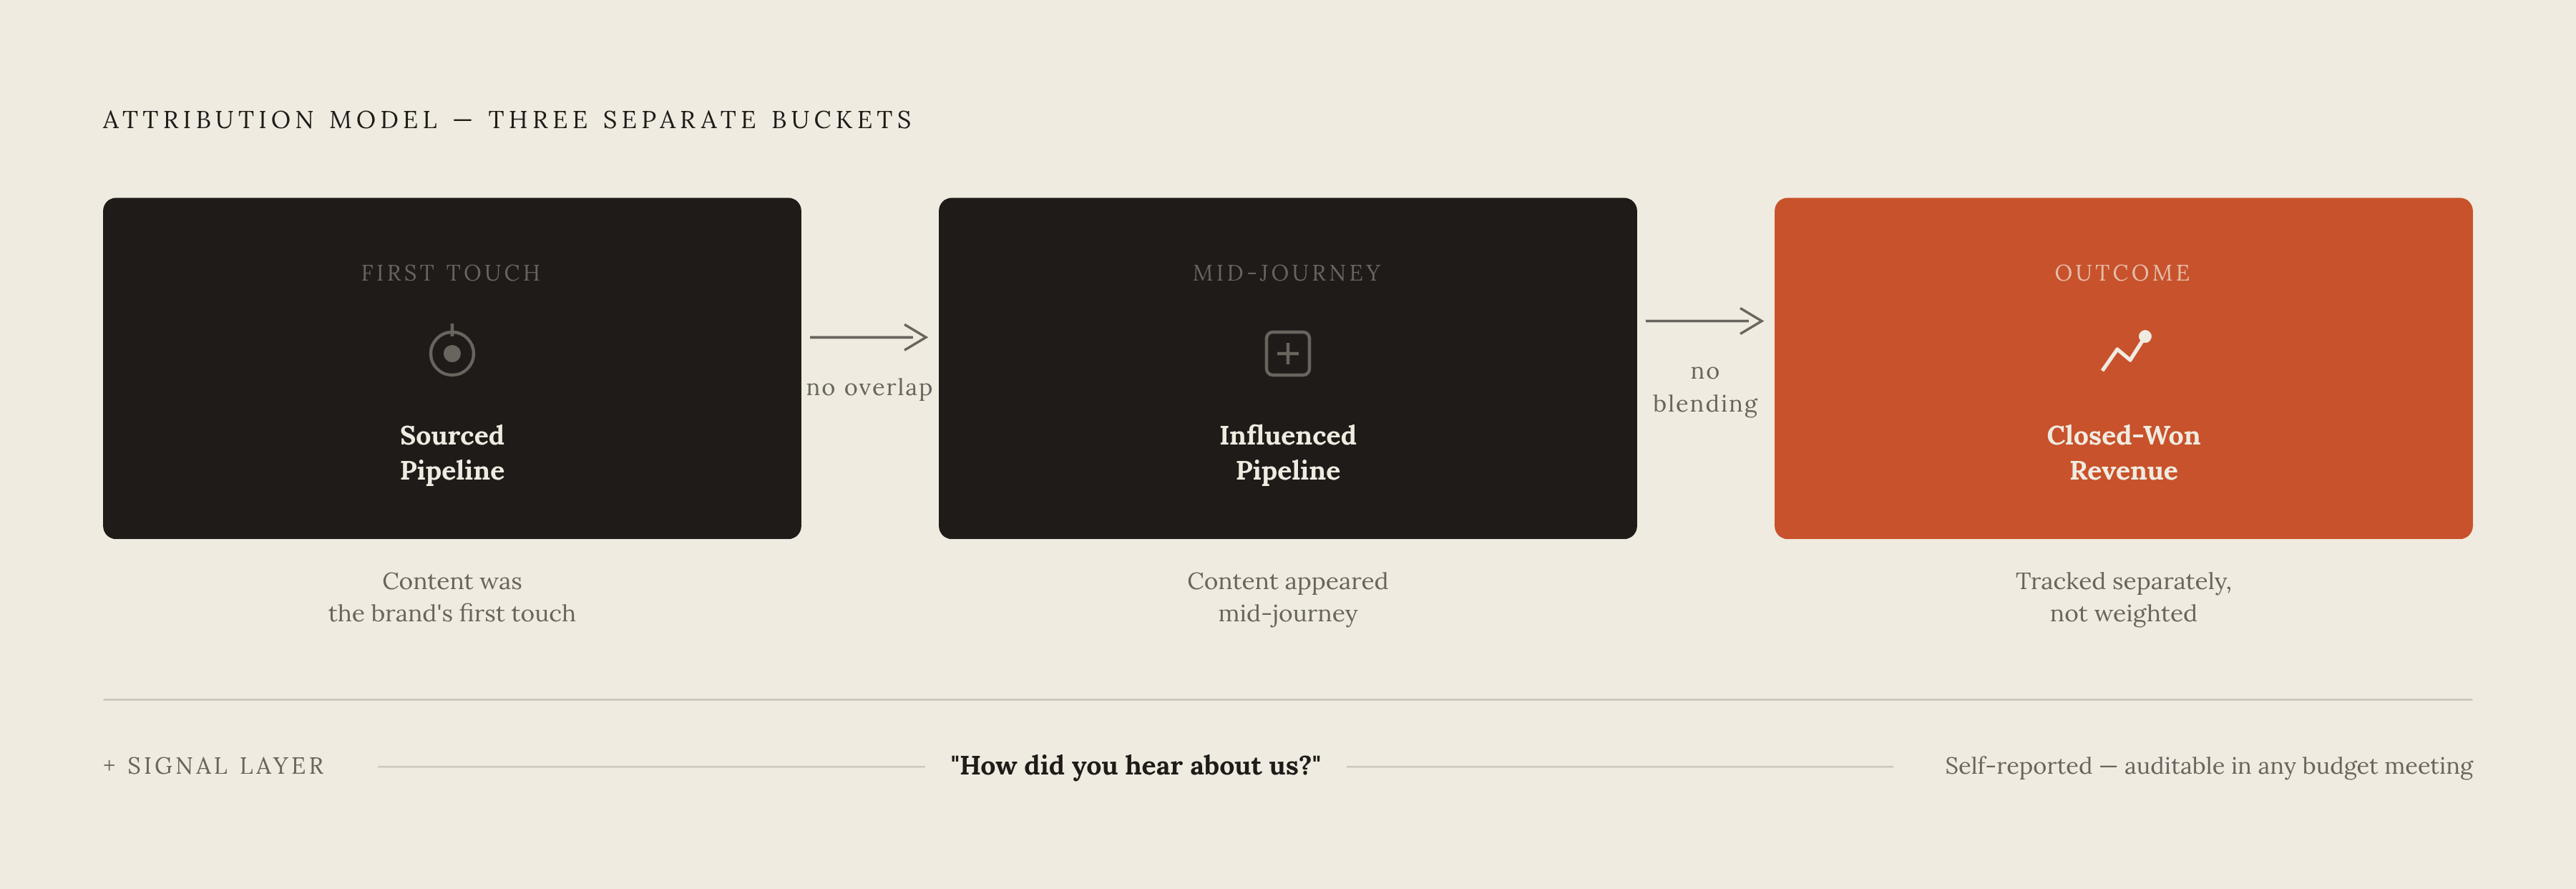
The practical alternative is a three-bucket model: sourced pipeline, where content was the first touch a prospect had with the brand; influenced pipeline, where content appeared somewhere in the journey without necessarily starting it; and closed-won revenue, tracked separately rather than algorithmically weighted against the other two. Paired with the self-reported "how did you hear about us" field, this model produces a directionally reliable signal that survives a leadership challenge because its assumptions are stated directly rather than hidden inside a model nobody in the room can audit.
The objection that a company needs multi-touch attribution to be taken seriously gets the logic backward. Rigor comes from being honest about what the data can and cannot support, not from running a complex model over data that cannot carry its weight. Only about a third of B2B marketers use any formal attribution model. Most of the teams successfully proving content's value to their own leadership are doing it with approaches simpler than multi-touch. None of this rules multi-touch attribution out permanently. Once conversion volume grows and the CRM has enough history to support a real model, the three-bucket approach can be upgraded. At the early stage, the goal is a measurement chain that survives a budget review and improves the quality of decisions being made right now, not a perfect model that nobody can yet feed with enough data to trust.
Reporting content ROI to leadership before the compounding curve is visible
Even a correctly built measurement chain produces numbers that look small in the first two quarters, because content's returns compound over time. A team that walks into a leadership meeting in month two with nothing but lagging revenue numbers is handing that leadership a reason to cut the program before the curve has had any chance to bend upward.
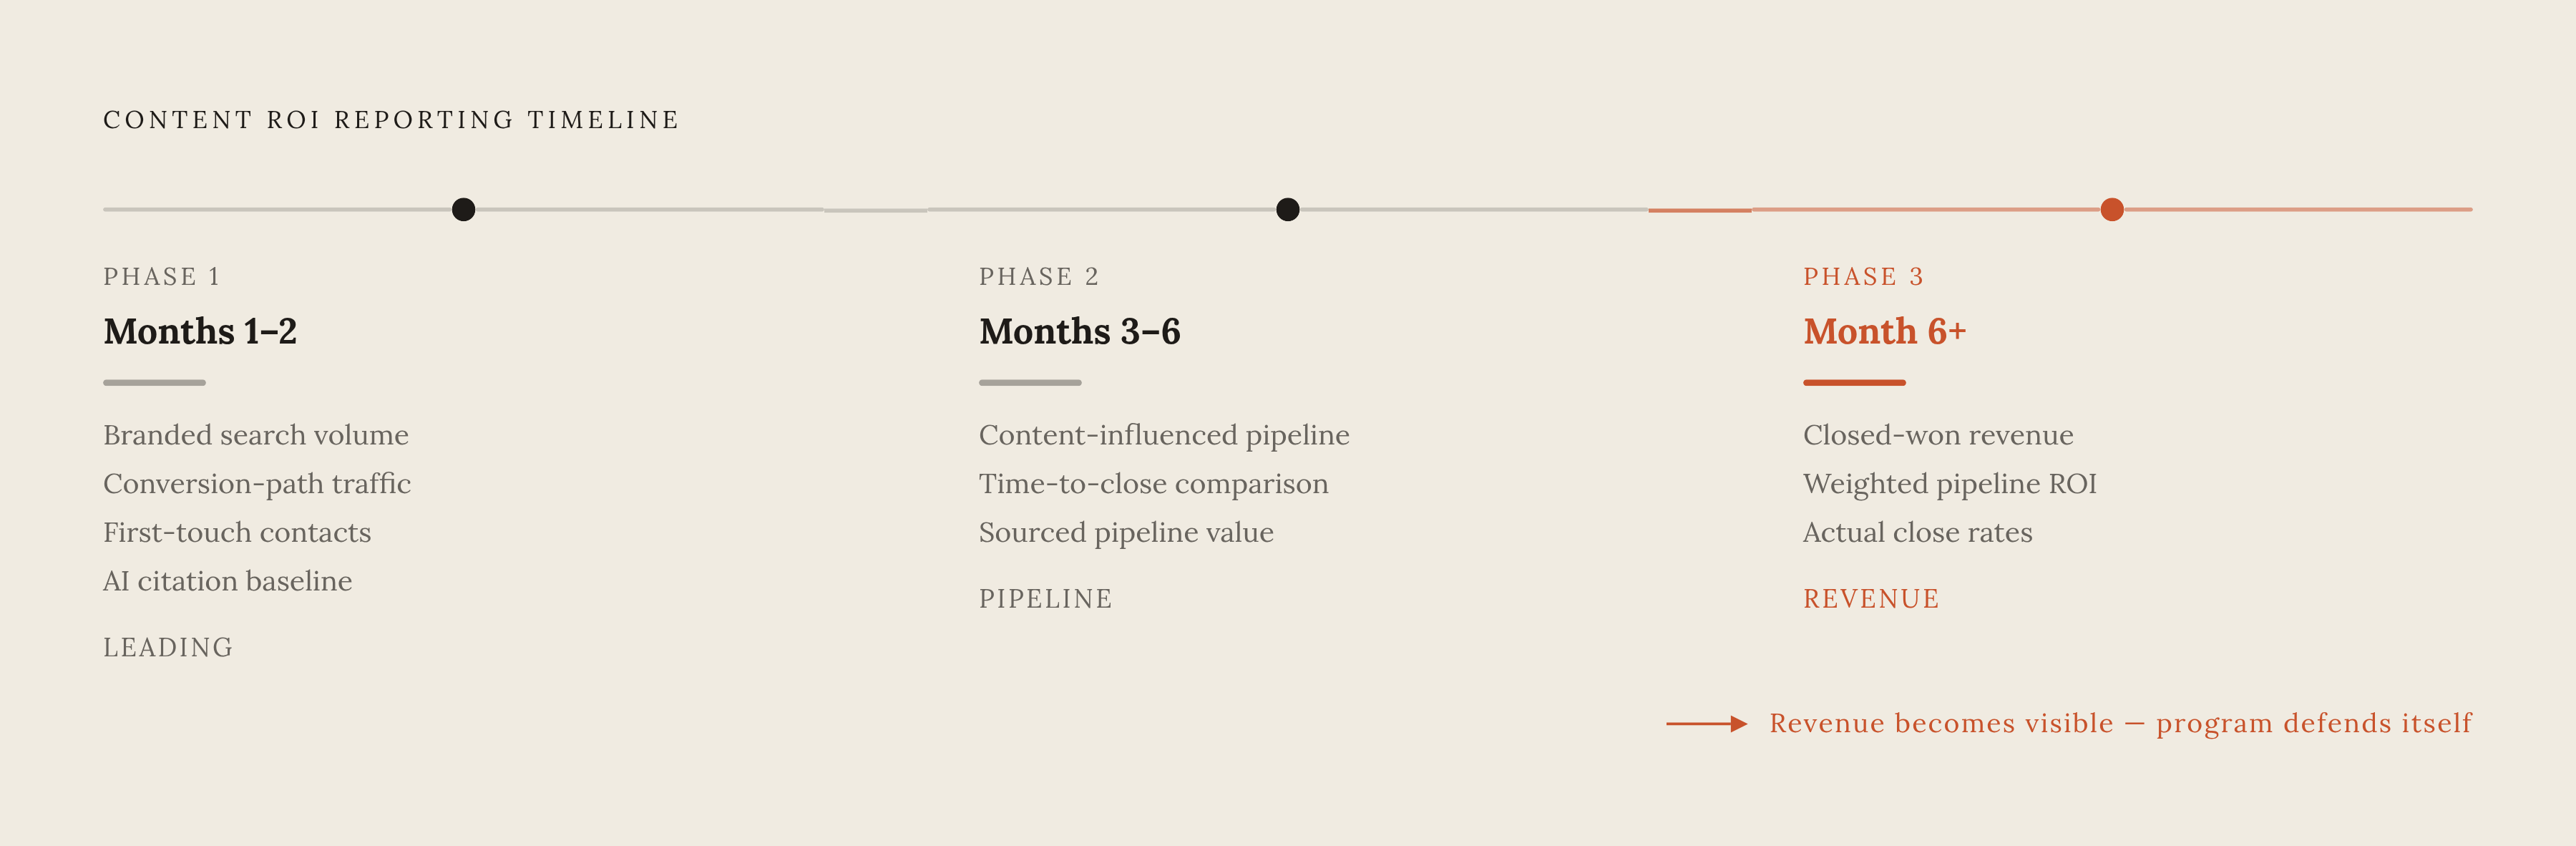
The fix is a staged reporting cadence that separates leading indicators from pipeline indicators from revenue indicators, so leadership sees a progression rather than a single premature verdict. In months one and two, the report should show leading indicators: the trend in branded search volume, growth in conversion-path traffic, the number of content-influenced first-touch contacts added to the CRM, and a baseline reading of AI citation share. In months three through six, the report shifts to pipeline indicators: the value of content-influenced pipeline, the time-to-close comparison between content-engaged and non-engaged leads, and the contribution of sourced pipeline specifically. At six months and beyond, the report finally shows revenue indicators: closed-won revenue with content somewhere in the path, and a weighted pipeline ROI figure updated against the close rates that have actually materialized by then.
Laying out that staged cadence explicitly at the start of the program, telling leadership directly what will be shown at each stage and why, sets a fair evaluation window before the first report ever lands on a desk. It preempts the conclusion that content doesn't work, a conclusion that early traffic numbers alone will always seem to support regardless of what is actually happening in the underlying measurement chain. Zapier's public case history shows what a fully connected report looks like once this chain is in place end to end, content tied to pipeline tied to revenue, told as one continuous story. The method works at the early stage precisely because it does not require a new metric that leadership has never seen before. It uses the same pipeline data sales already tracks every week, asking only for a tag on deals that the sales team already owns and already reports on.
Notes
- Top Content Marketing Statistics for B2B Teams in 2026
Provided the statistic that only about a third of marketers can accurately measure content marketing ROI.
- Top B2B Content Marketing Challenges in 2026 + Sales Fixes
Supplied context on data fragmentation, dark social, and attribution gaps as structural challenges for B2B content measurement.
- How to Measure the Success of Your Content Marketing Strategy
Informed the discussion of conversion-path traffic and connecting content activity to pipeline without enterprise tooling.
- B2B Marketing Attribution: The Complete 2026 Guide
Provided the basis for the discussion of attribution models, including why only a third of B2B marketers use any formal attribution model.
- B2B Digital Marketing Benchmarks 2026: ROI Metrics & Results
Supplied benchmark context on content ROI compounding over time versus paid channel performance flattening.